Breeding informatics

The Enterprise Breeding System (EBS)

The Enterprise Breeding System (EBS) is an open-source breeding informatics software being developed for crop breeding programs serving resource-poor farmers in Africa, Asia and Latin America.

The EBS connects, merges and builds upon existing breeding software and data solutions to offer a single powerful tool, so that breeders can focus on using data to create better varieties, faster.
2021 was the year of collaboration in breeding informatics

In March 2021, a new network of specialists, the Breeding Informatics Network (BrIN) was established to standardize and modernize breeding data storage, access, curation, analysis, visualization, and decision support. The ultimate goal of BrIN is to improve quality and efficiency in delivering improved varieties to farmers. On December 15, 2021, BrIN celebrated their 2021 successes, and recognized key contributors around the globe.

Breeding Informatics Network: Team progress in 2021

The Breeding Informatics Network (BrIN) convenes four teams of experts from across CGIAR breeding programs to assess the current state and requirements for analytics processes in the areas of genetic gains and experiment design, advancement decisions, genomic selection applications and marker-assisted breeding.

During the BrIN end-of-year celebration, 35 participants connected from around the globe to share their progress and successes in 2021, reflect on their impacts and recommend action plans for 2022.

Decision making in a commercial breeding program - BrIN Learning Series

An expert presentation and discussion on how Bayer increased data fluency and analytics to make better decisions. What did they learn and what changes were adopted over the last 10 years? Join Bayer, Cornell, EiB and partners for an examination of how over the years of testing, Bayer has aimed to get increasing confidence for performance in farmers’ fields and conditions. This includes increasing the number of locations and size of experimental plots.

Enterprise Breeding System hackathon

First steps taken to unify CGIAR-NARS breeding software


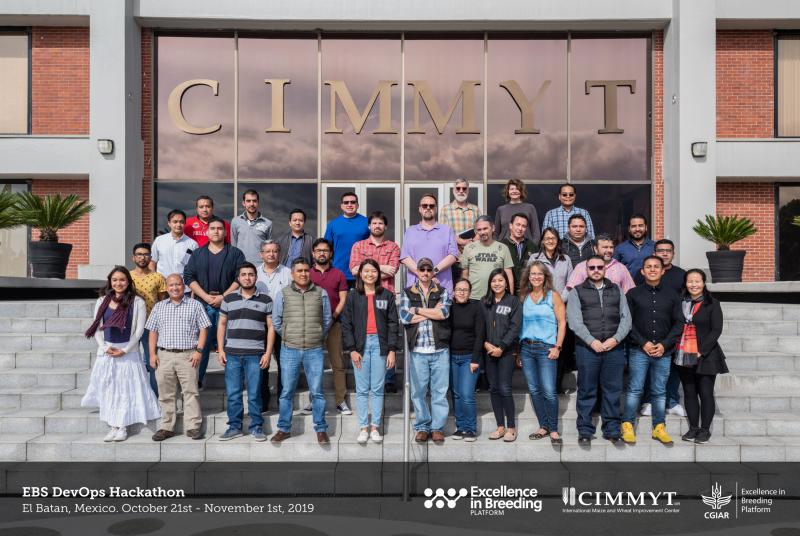
Photo credit: CIMMYT / Eleusis Llanderal Arango

From 21 October to 1 November, software developers and administrators from several breeding software projects met at the headquarters of the International Maize & Wheat Improvement Center (CIMMYT) in Mexico to work on delivering an integrated solution to crop breeders.

Inventory

Inventory is an open-source application that lets users collect inventory and weight data simultaneously. The app can perform as a standalone sample collection platform but is also compatible with Elane USB scales. These scales can be plugged directly into Android devices with USB OTG functionality. A USB hub can be used to allow both a scale and barcode scanner to run at the same time.

Linear selection indices in modern plant breeding

This book represents a compilation of work done in the area of “selection indices” in animal and plant breeding.

Selection indices were originally developed by Smith (1936) in plant breeding and by Hazel (1943) in animal breeding to address the selection of plants or animals scored for multiple traits.

In agriculture, the breeding worth (or net genetic merit) of a candidate for selection depends on several traits. For example, grain yield, disease resistance, and flowering time.

Highly Interactive Data Analysis Platform (HIDAP)

The Highly Interactive Data Analysis Platform (HIDAP) was developed for clonal crop breeders at the International Potato Center (CIP)

It is part of on-going efforts to unify best practices which practices include data collection, data quality and data analysis in clonal crop breeding. HIDAP builds on the former in-house tools DataCollector (DC) and CloneSelector (CS). These tools supported potato and sweetpotato breeding, respectively.

EiB Galaxy instance

Galaxy is an open-source application to enable researchers without informatics expertise to perform computational analyses through the web. A user interacts with Galaxy through the web by uploading and analyzing the data. Galaxy interacts with underlying computational infrastructure (servers that run the analyses and disks that store the data) without exposing it to the user.

SNPviewer

SNPviewer is a tool that enables genotyping data to be viewed as a cluster plot, but that does not include data analysis or reporting functionality.

Opening genotyping service project results in SNPviewer will allow you to view the genotyping clusters plate by plate. Genotyping calls cannot be changed within SNPviewer; if you need to be able to edit the calls then you will require our KlusterCaller software.


Coordinate

Coordinate replaces our previous DNA Plate App and Seed Tray App with a unified data collection app. Coordinate is based on defining templates and then collecting data in grids created from those templates. Two templates are included by default: Seed Tray and DNA Plate.

Verify

Verify is a simple app for importing and managing a list of entries. Utilizing an internal or external barcode scanner, Verify can identify individuals in the list, keep track of how many times they've been scanned, and order in which the items are scanned are correct.

In its simplest form, Verify is integral for viewing data associated with a given entry, making it very useful for sample tracking and management. Sample files are provided with the installation to demonstrate the utility of Verify in research programs.

Biodiversity analysis with R (BIO-R)

Biodiversity analysis with R (BIO-R) is a set of R programs that do biodiversity analysis of molecular data, in order to calculate heterozygosity, diversity among and within groups, shannon index, number of effective allele, percent of polymorphic loci, Rogers distance, Nei distance, cluster analysis and multidimensional scaling 2D plot and 3D plot

You can include external groups for colored dendogram or MDS plots, and additionally obtain a Core Subset using molecular data and also phenotypic, geographical and any source of data.

Bayesian Generalized Linear Regression in R (BGLRR)

Bayesian Generalized Linear Regression in R (BGLRR) is a software to simplify the selection of input files and parameters to perform Bayesian Generalized Linear Regression using R (statistical software).

BGLR provides predictions, genome-wide association study (GWAS) analysis and analysis of reaction norm models. It allows the inclusion of markers information, relationship matrix (pedigree), environmental covariables, and other variables as fixed or random effects.

Spatial Multi-Environment Trial Analysis with R (Spatial META-R)

Spatial META-R is a software to simplify the selection of input files and parameters to perform spatial multi-environment trial analysis using R (statistical software) and ASReml v1.0 free version.

Spatial META-R provides the calculus of best linear unbiased estimates (BLUEs), best linear unbiased predictions (BLUPs), genetic correlations among locations and genetic correlations between variables, and broad-sense heritability. Analyses may be performed by location, across management conditions or across all locations.

Field Book

Field Book was created to replace paper field books to enable increased collection speed with greater data integrity, using a novel collection system that only displays a single cell to be collected at a time.

Field Book can collect data in the following formats: numeric, percentage, categorical, date, Boolean, text, photo, counter, rust rating, and audio. Traits are defined by the user and can be exported and transferred between devices. Sample files are provided with the installation.

Flapjack

New software tools for graphical genotyping and haplotype visualization are required that can routinely handle the large data volumes generated by high throughput SNP and comparable genotyping technologies. Flapjack is a new visualization tool to facilitate analysis of these data types. Its visualizations are rendered in real-time allowing for rapid navigation and comparisons between lines, markers and chromosomes.

CurlyWhirly

CurlyWhirly provides data visualization in a 3D context, including but not limited to the output from Principal Coordinate Analysis and Principal Components Analysis.

Intuitive controls allow the data to be filtered or highlighted using categorical data such as from phenotypes, whilst its efficient memory usage and high-performance allows for real-time interactivity with very large data sets.

This functionality enables exploration of multidimensional data in such a way that facilitates finding patterns and outliers within the data

CurlyWhirly features: