


The common bean mid-density marker panel was developed from sequencing data of 1,700 breeding lines and landraces belonging to different breeding nurseries for biotic and abiotic resistances, commercial and agronomic traits, interspecific introgressions, and major representation from America and Africa breeding programs. Genotyped through whole-genome re-sequencing (WGS) and Genotyping by Sequencing (GBS) the combined genotypic matrix was produced assembling different sequencing efforts for diversity studies, pathogen resistances, cooking time, drought and heat tolerance, and bio-fortification (Lobaton et al, 2018; Keller et al, 2020, Diaz et al, 2020; Diaz et al. 2021a; Diaz et al. 2021b).
A 40 million SNPs matrix was filtered to compile the best allele marker catalogue for the diversity Array, and variants were selected by removing the SNPs within repetitive regions of the reference genome (Lobaton et al, 2018). For best primer annealing, and results reliability, the variants within the 300 bp regions are free of SNPs and with minor allele frequency (MAF) > 0.01. Based on the genetic map reported by Diaz et al. (2020), the predicted recombination frequency between SNP variants was calculated between the physical and genetic positions fitting a non-parametric Spline regression. The SNP variants were chosen per 0.5 cM windows along the reference genome.
A testing population composed with biological and technical replicates, and already genotyped lines was implemented as a control test using the DArTag targeted genotyping. Using technical and biological replicates it was possible to detect defective markers presenting missing data above 70 %, and heterozygosity above 6 %. This knowledge allowed the developing of a DArTtag SNP array (Ariza-Suarez et al., 2021) with a total of 1,861 SNP-containing target sites and that can be used by both African and Latin-American Common bean breeding programs.
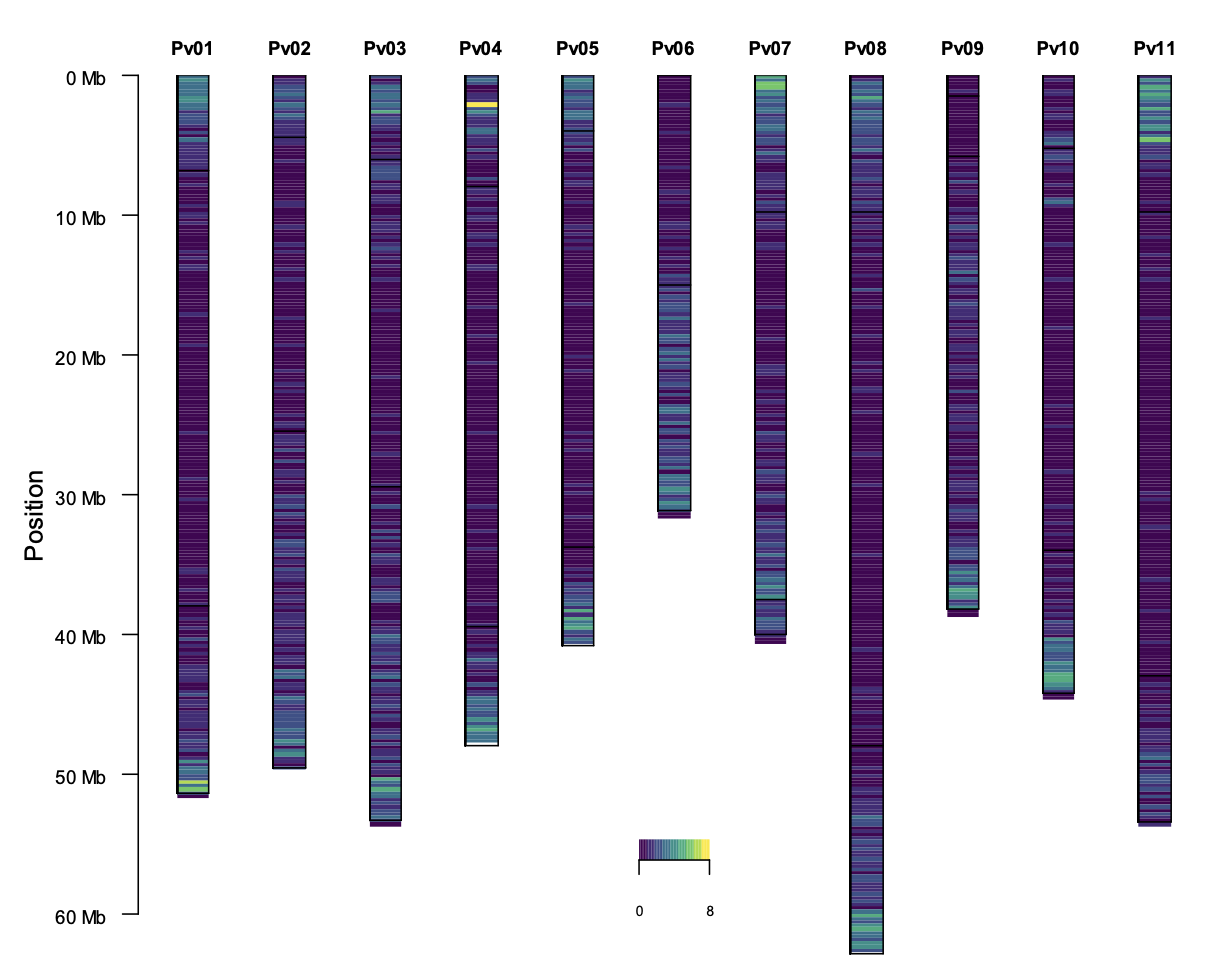
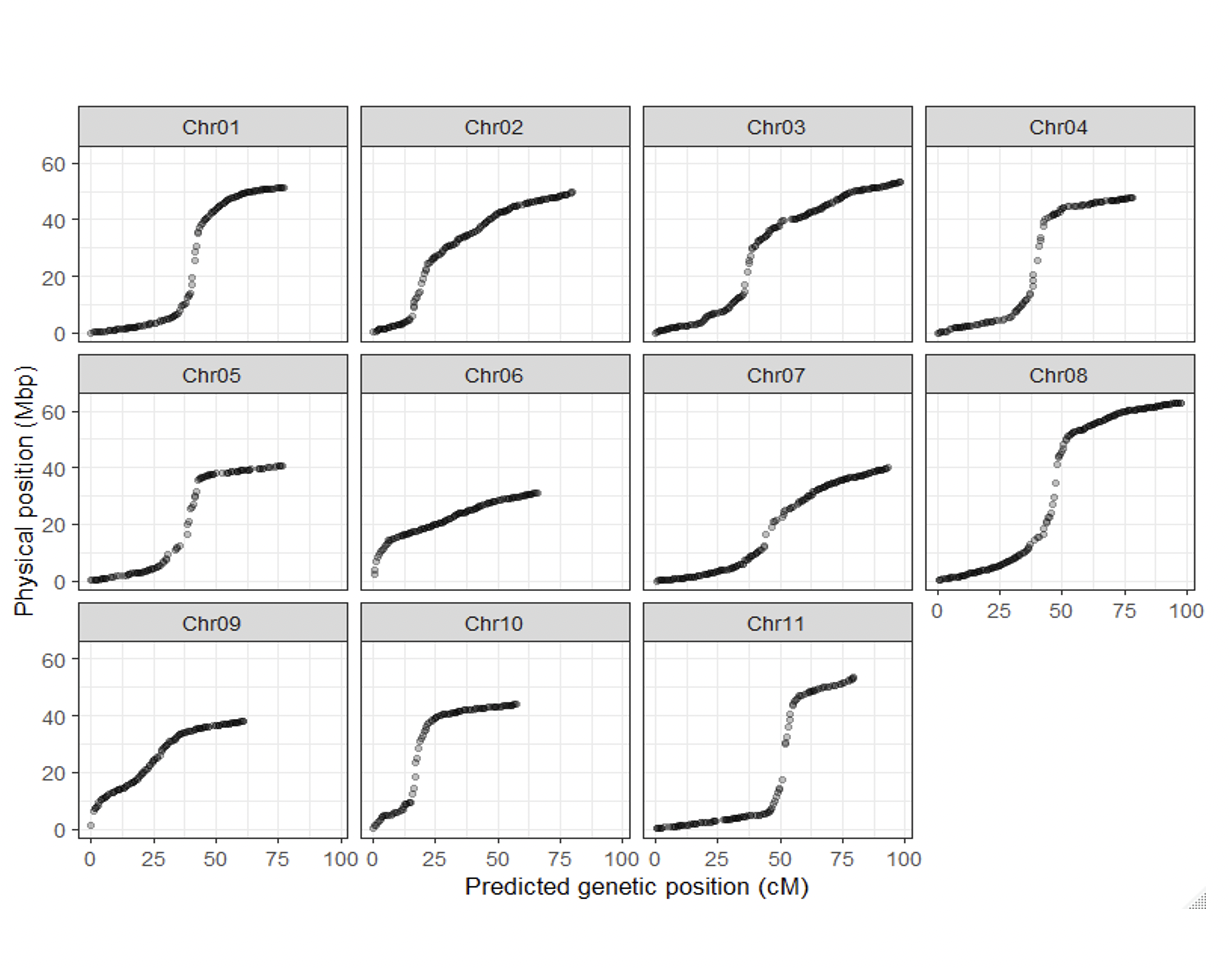
Figure. SNPs distribution along the genome. Left: Chromosome SNPs density distribution. Right: SNPs distribution according to the physical map (Mbp) and the predicted genetic position (cM).
This panel is suitable for marker-assisted breeding, diversity analyses and germplasm management applications.
Acknowledgements
Daniel Ariza and Bodo Raatz are acknowledged for markers development and curation.
References
- Ariza-Suarez et al. (2021) Genetic analyses for the response to Bean Leaf Crumple Virus (BLCrV) identify a candidate LRR-RLK gene. Bean Program, Agrobiodiversity Area. International Center for Tropical Agriculture Preprint.
- Diaz, S. et al. Raatz, B. (2020). Genetic mapping for agronomic traits in a MAGIC population of common bean (Phaseolus vulgaris L.) under drought conditions. BMC genomics, 21(1), 1-20.
- Diaz, S. et al. (2021a). Genetic architecture and genomic prediction of cooking time in common bean (Phaseolus vulgaris L.). Frontiers in plant science, 11, 2257.
- Diaz, L.M. et al. (2021b). Genetic analyses and genomic predictions of root rot resistance in common bean across trials and populations. Frontiers in plant science, 12.
- Keller, B. et al. (2020). Genomic Prediction of Agronomic Traits in Common Bean (Phaseolus vulgaris L.) Under Environmental Stress. Front. Plant Sci. 11.
- Lobaton, J.D. et al. (2018). Resequencing of common bean identifies regions of inter-gene pool introgression and provides comprehensive resources for molecular breeding. The plant genome, 11(2), 1-2.