
Registration: https://us02web.zoom.us/meeting/register/tZMvf-iopjgrH9GPVyHQ2-q9W1_su3YX0Plw
Getting to the bottom of what is causing a problem is difficult. Sometimes the person with the strongest opinion determines what steps will be taken to solve the problem. Many times the problem keeps coming back. Using root cause analysis tools can help take the emotion out of the discussion and systematically identify the main causes. Join us on March 16 to see how the Interrelationship Digraph works its magic to identify the main driver.
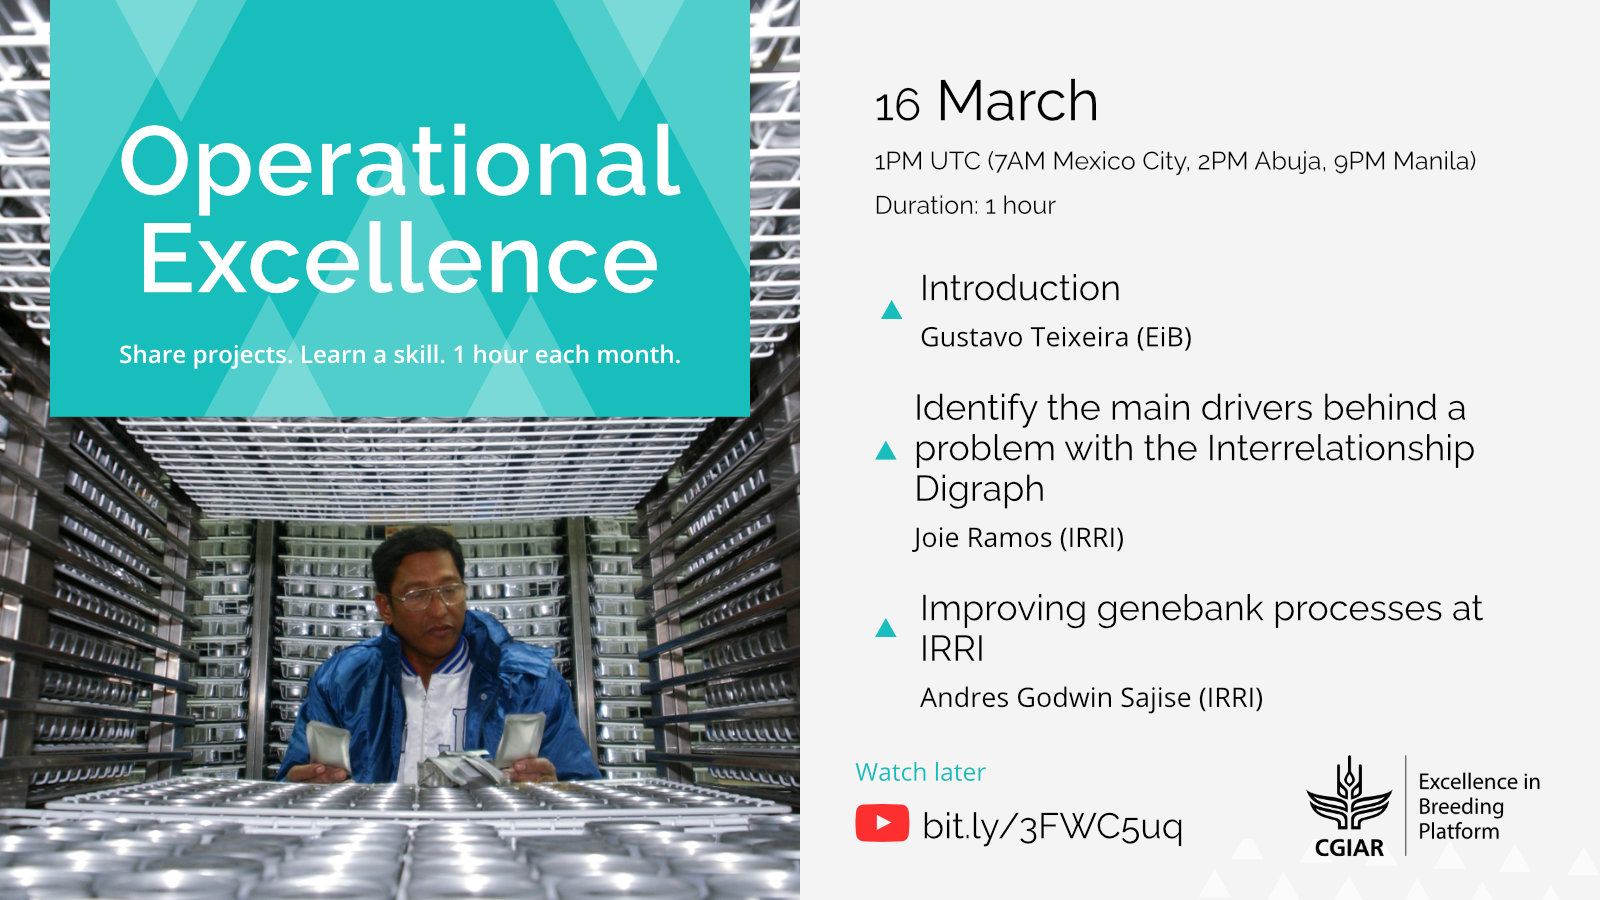
This webinar is one of our monthly Operational Excellence Webinars to support and promote a continuous improvement culture. All recordings of this webinar can be watched later at: bit.ly/3FWC5uq
Agenda
| Topic | Speaker(s) | (mins) |
| Introduction | Gustavo Teixeira (EiB) | 5 |
| Using the Fishbone Diagram results with the Interrelationship Digraph to identify the main driver. | Joie Ramos (IRRI) | 20 |
| Gene Bank Project at IRRI | Andres Godwin Sajise (IRRI) | 20 |
Objectives
The webinar will help participants understand or be able to do the following:
- Remind participants of learning in the last webinar with a review of root cause analysis and the results of the DH Seedling Survival project.
- Understand how root causes of complex problems can be uncovered by using some simple tools and methods.
- Learn how to use the Fishbone Diagram to identify potential causes of a problem and use them in an Interrelationship Digraph to identify the main driver.
- Listen to how IRRI improved the process of preserving highly value seed materials.