
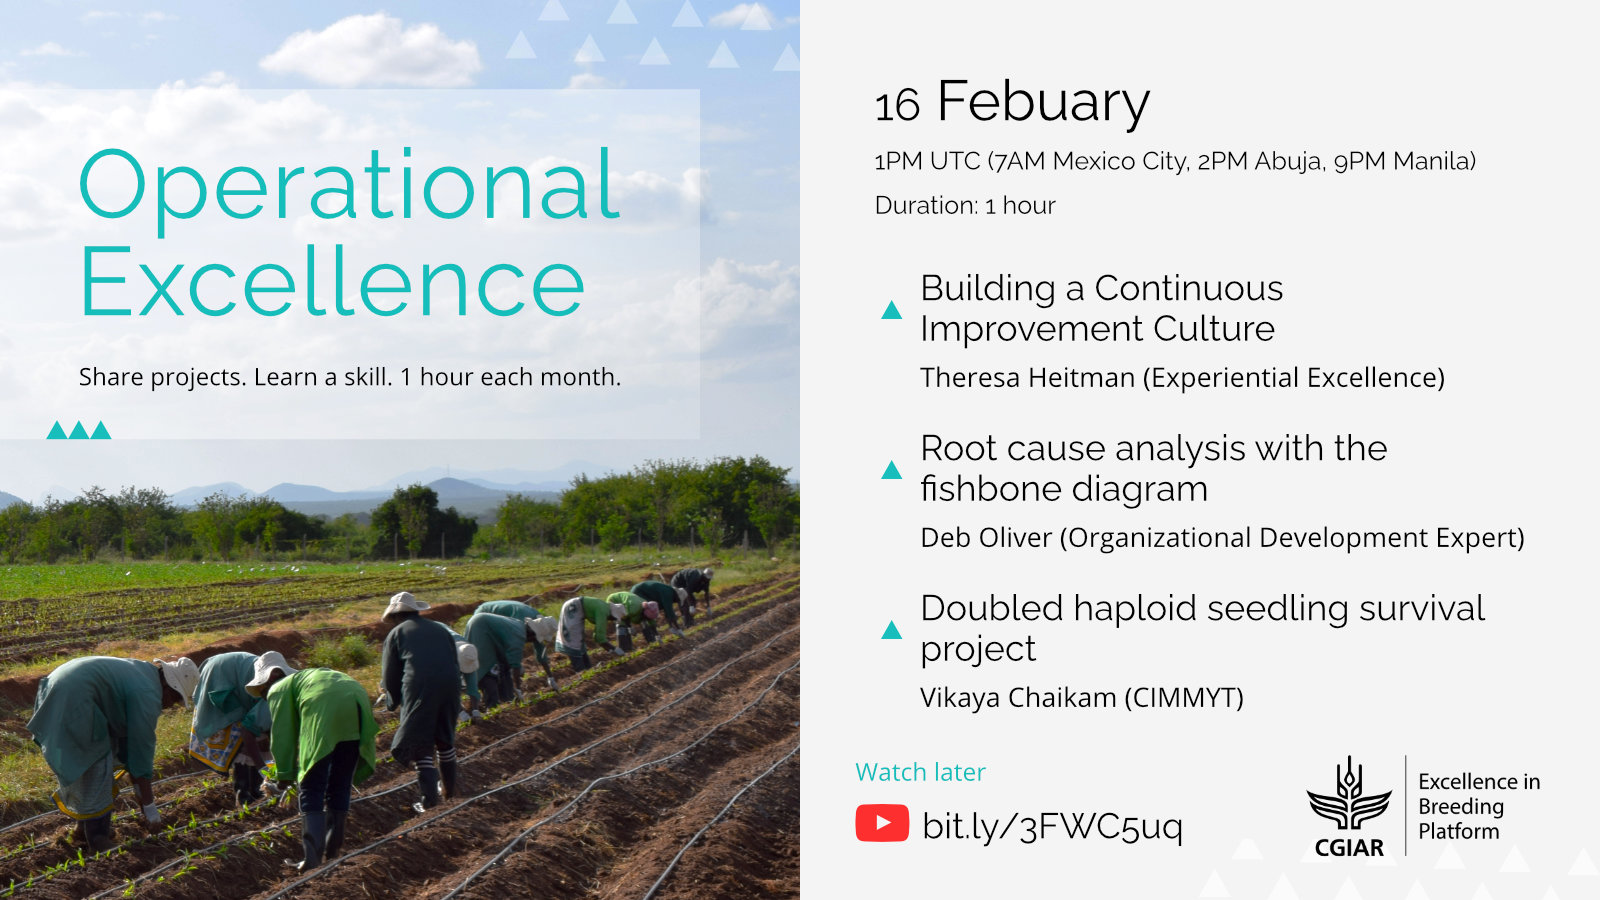
Time: 1PM UTC (7AM Mexico City, 2PM Abuja, 9PM Manila)
Registration: https://us02web.zoom.us/meeting/register/tZ0pfu6grDIiE9OSYvtrU1y5RPlkqEwLDTIG
Do you have a complex problem that just doesn’t seem to get solved? Maybe there are multiple causes to the problem. Identifying the possible causes using a Fishbone Diagram can help you select and prioritize the most likely causes. Join us on February 16 to learn this simple tool and how it can be used to improve processes.
The session begins with a brief presentation of the steps to developing a continuous improvement culture. Participants will then learn the Fishbone Diagram and how it is used to identify potential root causes of problems. Finally, a review of the Doubled Haploid Seedling Survival project conducted in CIMMYT will emphasize how identifying root causes and implementing solutions improved seedling survival.
To receive an invitation to attend, please register.
This webinar is one of our monthly Operational Excellence Webinars to support and promote a continuous improvement culture. All recordings of this webinar can be watched later at: bit.ly/3FWC5uq
Agenda
| Topic | Speaker(s) | (mins) |
| Introduction | Gustavo Teixeira (EiB) | 5 |
| Steps to building a Continuous Improvement culture | Theresa Heitman (Experiential Excellence) | 10 |
| Using the fishbone diagram in root cause analysis | Deb Oliver (Organizational Development Expert) | 15 |
| Doubled haploid seedling survival project | Vijaya Chaikam (CIMMYT) | 20 |
| Questions to all presenters | 10 |
Objectives
The webinar will help participants understand or be able to do the following:
- Remind participants of learning in the last webinar with a quick review of the CIT, 5 Whys, and the crop health project results.
- Introduction to some basic steps to develop a continuous improvement culture.
- Understand how root causes of complex problems can be uncovered by using some simple tools and methods.
- Learn how to use the Fishbone Diagram to identify potential causes of a problem.
- Observe how Root Cause Analysis was applied in the DH Seedling Survival project.